


Investors should expect more downside in the market after stocks bounced from a multiday losing streak, CNBC's Jim Cramer said Thursday.
The benchmark S&P 500 index rose 1.15% during the session after pulling back from Monday's close.
"The bad news is that the charts, as interpreted by Mark Sebastian, suggest that today's rebound is just a temporary reprieve from what could be a bigger sell-off," the "Mad Money" host said. "But once the last leg lower runs out, well, then, he thinks we could get a real, buyable bottom."
Sebastian, Cramer's trusted volatility expert, has anticipated that the market was due for another leg down after a short-lived advance.
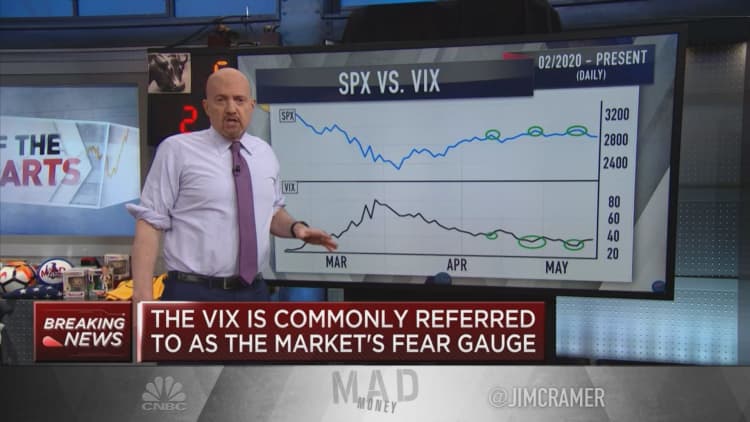
Comparing the weekly activity in both the S&P 500 and the CBOE Volatility Index, often referred to as the VIX or fear gauge, the OptionPit.com founder noted that the VIX surged as the broad index began to roll over on Tuesday, Cramer said.
The VIX rose from the mid-20s to a peak of 39 as the S&P 500 slid nearly 4% over the last two trading days. The fear gauge, which typically runs counter to the market, pulled back to 34 on Thursday as the S&P 500 climbed more than 32 points to 2,852.50 at the close.
"For weeks, Sebastian's been waiting for the other shoe to drop, and he thinks this is it," Cramer said. "The fact that the averages rebounded today is not necessarily a positive from his perspective. That just means we're seeing enormous volatility, and, to Mark, enormous volatility is not a healthy market."
The VIX is used as a measure of panic in the market. The volatility index and the major averages tend to trade in opposite directions, such as when it spiked from about 14 in mid-February to peak in the 80s a month later. The S&P 500 plunged more than 30% in a historic sell-off on Wall Street as coronavirus fears threw the market in turmoil.
Sebastian, however, thought the February-March downside was unusually short, Cramer explained. The chartist assessed a month ago that fear had been taken out of the market, but the upside in April was a bit of a surprise.
He's expecting more pain is in store.
"I wouldn't be surprised if he's right," Cramer said.
Questions for Cramer?
Call Cramer: 1-800-743-CNBC
Want to take a deep dive into Cramer's world? Hit him up!
Mad Money Twitter - Jim Cramer Twitter - Facebook - Instagram
Questions, comments, suggestions for the "Mad Money" website? madcap@cnbc.com