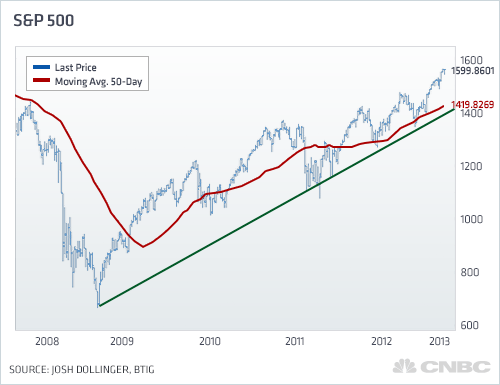
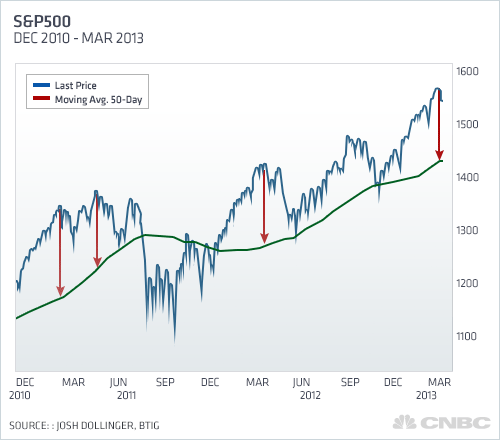
What happened the last three times the S&P got this high above its 200-day? Well, just take a look at the chart.
That last down arrow indicates where Dollinger thinks the market will go.
And if these charts don't say enough, Dollinger also notes that he has history on his side. In every year since 1996, the S&P has suffered at least one 5 percent correction by May.
Why, then, should this year be any different?
All that being said, Dollinger does not think the market is due for an all-out, no-holds barred sell of – only a "healthy pull-back."
Once it drops 5 to percent, Dollinger would advise investors to step back in and buy.
— By CNBC's Alex Rosenberg
Watch "Futures Now" Tuesdays & Thursdays 1p ET exclusively on FuturesNow.CNBC.com!
Like us on Facebook! Facebook.com/CNBCFuturesNow
Follow us on Twitter! @CNBCFuturesNow


