

Downsizing slowed in August but was still up from a year ago according to Challenge, Gray & Christmas (see story here). Tomorrow, we will get the jobless claims numbers and on Friday we will get the latest non-farm payroll and employment numbers from the Bureau of Labor Statistics. The consensus numbers for jobless claims is 420K while non-farm payrolls is expected to shed another 75K jobs. The unemployment rate is expected to rise to 5.8%. Where are the jobs being lost?
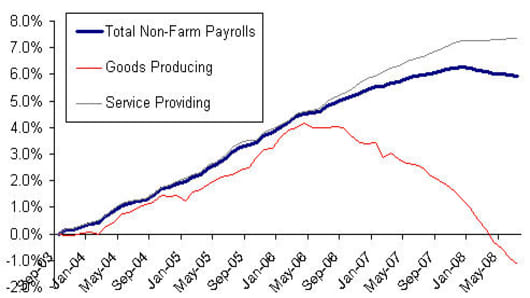
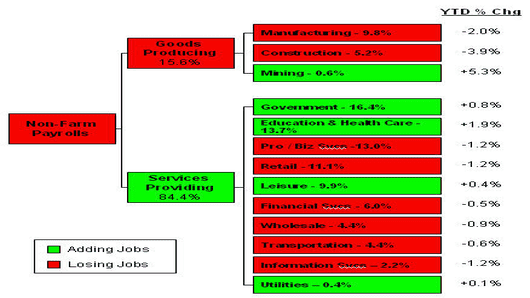
Since the low of 5 years ago, payrolls rose steadily until mid 2006. Goods producing companies began to lose jobs while the services sector continued to add jobs. On a YTD basis, services continue to add jobs, just at a slower rate (+ 0.1% YTD). As US employment is weighted more heavily to services (nearly 84% services vs. 16% goods producing), the total payroll numbers did not begin to fall until more recently.
Peeling back the onion further, you see what has really been supporting the numbers are gains in the Government, Education and Healthcare sectors. They are the largest contributors to the payroll numbers, representing ~30% of jobs and are up the most YTD. The Government growth has come at the State and Local levels. Manufacturing and Construction are down the most, shedding over 561K jobs since last December.
The employment numbers don't always fit perfectly with the equity markets. Jobs numbers are a lagging indicator while the stock market is a leading indicator. In a slowing economy, investors often turn to the Consumer Staples as a defensive play. In fact, this sector is the top performing sector YTD. Wrigley and Budweiser are goods producing companies that are up over 30% YTD. General Mills and Estee Lauder are also up over 15% YTD. The Consumer Discretionary sector is the next best performing sector, led by Big Lots which is up 94% YTD, despite retail losing 180K jobs YTD.
Comments? Send them to bythenumbers@cnbc.com
