Market 360: The Week's Best & Worst

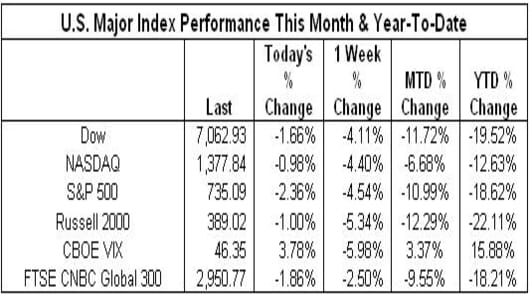
On a week that saw the US economy contract more than expected, the government boost its equity stake in Citigroup, GE cut its dividend, and President Obama present his budget, the markets fell through May 1997 lows, ending the week down 4% or greater.

*The Dow & S&P turn in their worst February performances since 1933 when the Dow lost 15.62% and the S&P lost 18.44%
**The Dow turns in its biggest February point drop since its inception in 1896, losing 937.93 points for the month
*The NASDAQ turns in its worst February performance since 2002 when the NASDAQ lost 10.47%
*On a positive note, the Dow, S&P and NASDAQ tend to have a positive performance in March 60% of the time.

Index Impact:
-IBM (IBM) had the most positive impact on the Dow, up almost 4% for the week.
**YTD, the top Dow performer by % gain remains IBM up over 9% YTD, ALL other Dow components remain negative YTD
*Note in February MTD, Wal-Mart (WMT) and IBM are both positive
-Boeing (BA) had the most negative impact on the Dow, down almost 13.5% for the week
**YTD, Citigroup (C) continues to be the worst Dow performer by % loss, down almost 78% YTD
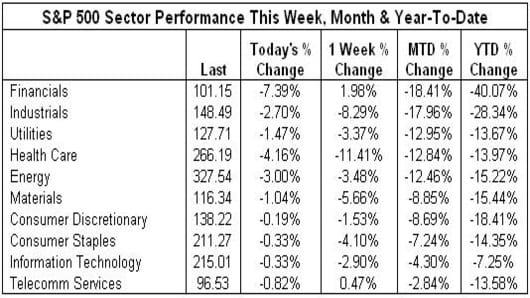
-JPMorgan (JPM) had the most positive impact on the S&P 500, up over 15% for the week.
**YTD, the top S&P performer by % gain remains Sprint Nextel (S), up almost 80% YTD
-Exxon (XOM) had the most negative impact on the S&P 500, down almost 5% for the week.
**YTD, the bottom S&P performer by % gain is Huntington Bancshares (HBAN) down almost 81% YTD
-Yahoo (YHOO) had the most positive impact on the NASDAQ 100, up almost 9% for the week.
**YTD, the top NASDAQ 100 performer by % gain is Amazon.com (AMZN), up over 26% YTD
-Microsoft (MSFT) had the most negative impact on the NASDAQ 100, down over 10% for the week.
**YTD, the worst NASDAQ 100 performer by % loss is Wynn Resorts (WYNN), down over 50% YTD

No Title_29434261


Sector Impact:
8 out of 10 S&P sectors were negative for the week led by Health Care, down over 11% for the week. Financials led the S&P sectors to the upside, gaining almost 2% for the week.
*YTD all 10 sectors are negative led by Financials down 40% YTD.
Health Care was dragged down by Humana (HUM) down almost 42% for the week
Financials were helped by Fifth Third Bancorp (FITB) up almost 105% for the week

No Title_29434265


More Weekly Stats Here

Commodity Impact:
Worse-than-expected GDP data for the US helped ease a sell-off in gold, but the April contract for the precious metal still ended the week down almost 6% to settle at $942.5 per oz.
Oil for April delivery settled at $44.76 per barrel up almost 14% for the week.
Gas Prices: The AAA current national average for regular gas is $1.883 per gallon down 40.43% from a year ago when the average was $3.161 per gallon
-The highest recorded average price by AAA was on 7/17/2008, when the national average was $4.114 per gallon

No Title_29434272


Currency Impact:
The US dollar rallied again this week as it strengthened its position as a safe-haven play. The dollar gained against the yen, euro, pound sterling and Swiss franc for the week. For the month, the greenback gained over 8.5% versus the yen, pacing for its biggest-monthly-percent gain since August 1995.

Commodity Impact:
Worse-than-expected GDP data for the US helped ease a sell-off in gold, but the April contract for the precious metal still ended the week down almost 6% to settle at $942.5 per oz.
Oil for April delivery settled at $44.76 per barrel up almost 14% for the week.
Gas Prices: The AAA current national average for regular gas is $1.883 per gallon down 40.43% from a year ago when the average was $3.161 per gallon
-The highest recorded average price by AAA was on 7/17/2008, when the national average was $4.114 per gallon

No Title_29434274


Note: Data based on preliminary numbers. May adjust slightly due to settling at close.

Comments? Suggestions? Send them to
bythenumbers@cnbc.com
Bythenumbers.cnbc.com