In my blog post on Tuesday morning March 10, 2009, I wrote, “ The cycle work and roadmap we have been following indicate that the patient may be starting to wake up - having been in its agonal stages and left for dead. When it turns, it could be shock and awefor a few weeks.”
On March 10, 2009, global equity markets experienced a strong rise after reaching new lows for the bear market. The markets have had strong moves before, only to turn back down and decline to previous lows or even new lows. Is it different this time? That is a dangerous question, but we are not ones to shy away from danger — so let’s see what the money is telling us.
We have never seen a market bottom on good news. Because markets are forward-looking, it is prudent to watch the reaction to news rather than the news itself. When selling is exhausted, stock prices rise even though negative news continues. One of the best ways to measure the strength of an uptrend is to examine the ratio of advancing issues to declining issues ( A/D) on the NYSE Composite Index ( $NYA).
My colleague Dave Harder examined every US stock market advance since 1970. Dave found that market bottoms were reached and strong uptrends followed when there were more than twice as many advancers vs. decliners for ten consecutive trading days (A/D10). This research does not tell us what analysts think should happen. It tells us what the money is doing. Dave’s A/D10 shows that money has been flowing into equities in a strong, unequivocal manner.
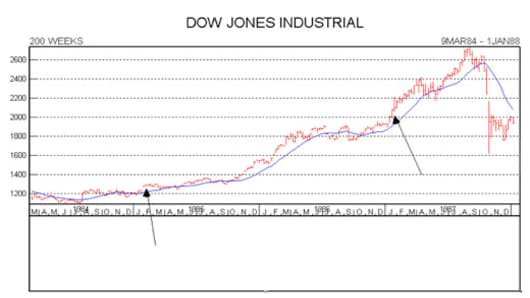
The A/D 10 occurred 6 times in the last 39 years—most recently on March 23, 2009. It also happened several weeks after the low in the 1973-1974 bear market and two weeks after the bottom in the 1982 bear market. Per Dave’s studies, the previous A/D 10 dates were: January 14, 1987; January 23, 1985; August 23, 1982; January 7, 1976; January 13, 1975; and December 7, 1970.