Market 360: The Week's Best & Worst

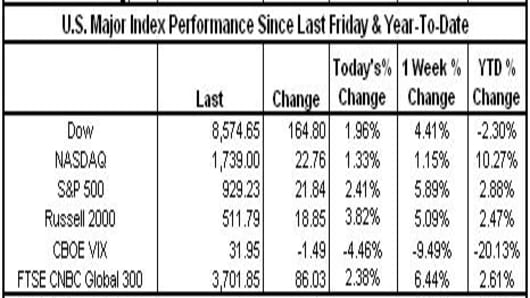
On a week dominated by the stress test for the banks, a rally in Financials, and the jobs report lending to increased optimism that the recession may be easing; the markets extend their rally to 9-straight weeks for the NASDAQ, and an almost 6% weekly gain for the S&P 500.

  • The last time the NASDAQ experienced 9 straight weeks of gains was December 1999
  • Less than 25% of the companies in the NASDAQ 100 are negative YTD
  • Since March 9th lows, the Dow is up 30.97%, while the NASDAQ is up 37.08% and the S&P is up 37.35%

Index Impact:

-JPMorgan (JPM) had the most positive impact on the Dow, up almost 20% for the week
**YTD, American Express (AXP) is the top Dow performer by % gain, up over 53% YTD
**10 Dow components are positive YTD: AXP, JPM, IBM, DIS, DD, HD, BA, MMM, INTC, BAC
-IBM (IBM) had the most negative impact on the Dow, down almost 3% for the week
**YTD, General Motors (GM) is the worst Dow performer by % loss, down almost 50% YTD
-Wells Fargo (WFC) had the most positive impact on the S&P, up almost 44% for the week
**YTD, the top S&P performer by % gain is XL Capital (XL) up almost 201% YTD
-Microsoft (MSFT) had the most negative impact on the S&P and the NASDAQ 100, down over 4% for the week
**YTD, the bottom S&P performer by % loss is Eastman Kodak (EK) down almost 53% YTD
**YTD, the worst NASDAQ 100 performer by % loss is Apollo Group (APOL) down almost 26% YTD
-Google (GOOG) had the most positive impact on the NASDAQ 100 up almost 3.5% for the week.
**YTD, the top NASDAQ 100 performer by % gain is Sun Microsystems (JAVA), up over 139% YTD

No Title_30647269


Sector Impact:

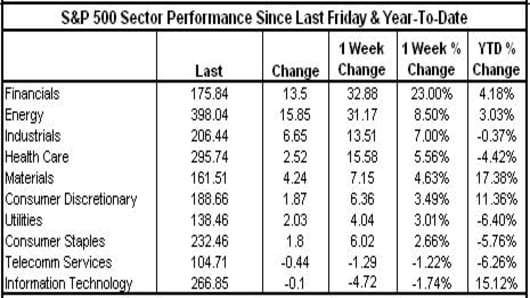
Eight out of ten S&P sectors were positive for the week led by Financials up 23% for the week. Tech was the most negative sector, down almost 2% for the week.

  • Financials were helped by Fifth Third Bancorp (FITB) up almost 121% for the week
  • Tech was hurt by NVIDIA (NVDA) down almost 21% for the week
  • Year-to-date, 5 out of 10 sectors are now positive led by Materials up over 17% YTD. Utilities are the laggards in 2009, down over 6% YTD.
No Title_30647268


More Weekly Stats Here

Commodity Impact:

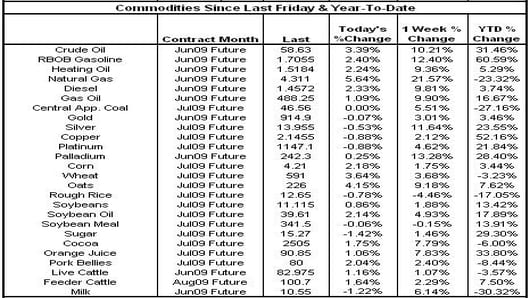
Oil settled at $58.63 per barrel, hitting levels not seen in almost 6 months.
Gas Prices: The AAA current national average for regular gas is $2.169 per gallon down 40.49% from a year ago when the average was $3.645 per gallon
-The highest recorded average price by AAA was on 7/17/2008, when the national average was $4.114 per gallon

No Title_30647267


Currency Impact:

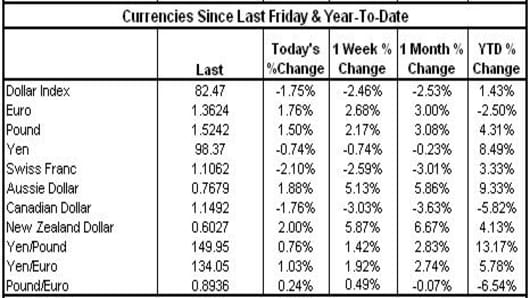
The US dollar continues to lose ground against the euro and pound sterling on the better-than-expected jobs report which has investors looking at riskier investments.

Commodity Impact:

Oil settled at $58.63 per barrel, hitting levels not seen in almost 6 months.
Gas Prices: The AAA current national average for regular gas is $2.169 per gallon down 40.49% from a year ago when the average was $3.645 per gallon
-The highest recorded average price by AAA was on 7/17/2008, when the national average was $4.114 per gallon

No Title_30647265


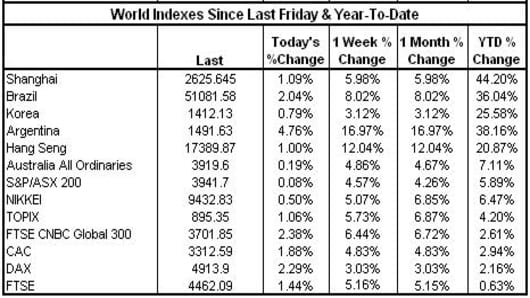
Global Indexes' Performance led by Asia and Latin America:

Commodity Impact:

Oil settled at $58.63 per barrel, hitting levels not seen in almost 6 months.
Gas Prices: The AAA current national average for regular gas is $2.169 per gallon down 40.49% from a year ago when the average was $3.645 per gallon
-The highest recorded average price by AAA was on 7/17/2008, when the national average was $4.114 per gallon

No Title_30647264


Note:Data based on preliminary numbers. May adjust slightly due to settling at close.

Comments? Suggestions? Send them tobythenumbers@cnbc.com

Bythenumbers.cnbc.com