Schork Oil Outlook: Are The Nat Gas Bulls Out of Breath?

Natural gas prices began the week with a whimper instead of a bang, closing yesterday 1.8% lower at 5.625. That marks the third consecutive day the bulls have failed to break out higher. Of course, prices remain at their highest point since October, when they actually crossed 6.00, so we are not taking yesterday’s trades too seriously. After dipping in the morning, prices couldn’t break through support at 5.630, hovering around 10 ticks above.

Last week the US Government reported that net commercial crude oil stocks saw a large draw. Much of that decline came from a second consecutive >5MMbbl draw in the Gulf Coast (PADD 3). We also saw a big draw in the West Coast (PADD V). This was enough to push prices off their 9 day losing streak (the longest consecutive string of down days since 2001) and safely above the $70 psychological barrier.

Of the major products, No.2 oil supplies dropped by 2.98 MMbbls (-1.8%) to 164.4 MMbbls. The bulk of the draw accrued on the heating oil side of the ledger. Heating oil stocks in the East (PADD I) fell, but given the plunge in temperatures, this is hardly surprising. Conversely, severe winter storms across heavy population centers discouraged demand for transportation fuels. Supplies of gasoline rose by a seasonal 0.88 MMbbls or 0.4% to 217.2 MMbbls, the highest level since April.

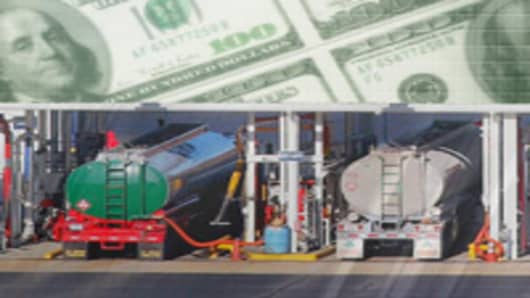
dollar_oil_tanks_1.jpg

Traders were also cognizant of the fact that a 1.07 MMbbl build in the Midwest (PADD 2), which includes the NYMEX Hub in Cushing, OK, pushed supply to 88.5 MMbbls, its highest level since April 1981. If the missing barrels from PADD 3 return in January, as they have for 22 of the last 27 Januarys, we could see a serious supply glut.

The net effect of this push and pull was a sharp contraction in the forward month WTI contract on the NYMEX, but a dampened effect along the rest of the calendar curve. Contracts for January delivery jumped 5.5% from $69.51 on the 14th of December (two days before the DOE’s report), to $73.36 on the 18th (two days after the DOE’s report).

The rest of the curve shifted directly upwards by ˜$1.30, but as you can see in the Chart of the Day in today’s issue of The Schork Report, its gradient remained the same. Does that imply prices were underpriced below $70 or that they’re overpriced above $74?

The Carbon Challenge - A CNBC Special Report - See Complete Coverage

This weakening of the front month could be caused by barrels returning to PADD 3 after disappearing in December for tax year considerations. This effect could be especially heavy this year given the surplus in PADD 2. However, if the crude oil bulls return from holiday with the intention of pushing prices above $80, momentum alone could cause the ratio to expand towards parity.

The bottom line is that momentum will be in play this January, so while we normally see an increase in the gradient of the forward curve i.e. weak front month relative to the future, bullish momentum towards $80 could cause extreme flattening in the short term.

More on CNBC.com

_________________________

Stephen Schork is the Editor of, "The Schork Report"and has more than 17 years experience in physical commodity and derivatives trading, risk systems modeling and structured commodity finance.