The stock market looks technically shaky, in addition to all its other woes.
“The market last week went from bent to broken,” said Scott Redler, of T3Live.com.


The stock market looks technically shaky, in addition to all its other woes.
“The market last week went from bent to broken,” said Scott Redler, of T3Live.com.
“The market closed on the lows Friday, and closed below the 200-day moving average. Right now, that’s two good reasons to be out of the market,” said Redler, who follows the market’s short term technicals. Redler said, however, the time to sell has passed, and it’s dangerous to sell on emotion.
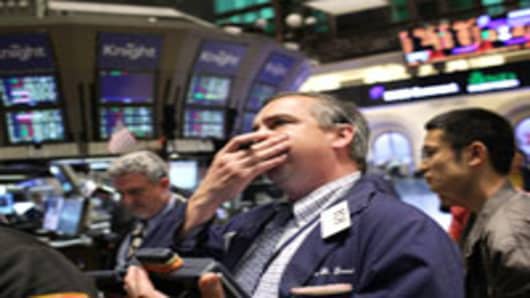
Stocks plunged Friday and look set to open lower Monday after a miserable U.S. employment report confirmed fears of a slowdown in the U.S. economy, which was viewed as a global stalwart against a slowing China and weakened Europe.
The S&P 500 lost 2.5 percent Friday, ending at 1,278, below its 200-day moving average at 1,284.
“We’re through the 200-day. Sometimes we bounce around the 200-day and have false breakdowns. More significant to me was we basically broke through the 38.2 percent Fibonacci retracement,” said Barry Knapp, chief equity portfolio strategist at Barclays. Knapp said that level was 1,296, and it represents the retracement from the October low to April’s high.
“1,296 was an area it held the first time. We went down there, and then we smashed through it on Friday,” said Knapp. He said the 50 percent retracement would be 1,258. Knapp has said he expects the selloff to take stocks to 1,200, or even lower.
The pending Greek election and worries about Spain helped drive stocks lower last week, in a vacuum of commitment from European leaders to take steps to stem the problems. As soon as the poor May jobs report was released, market talk turned to the Fed and the prospect for easing by the U.S. central bank.
“People are talking about policy response, but it’s pretty premature for that,” said Knapp. “While some people might speculate global growth will bottom out, there’s no sign of that. You have growth numbers going the wrong way, and it’s early for a policy response. It just leaves the market in a tough spot,” said Knapp.
He said it does not seem likely the European Central Bank will take any moves at its meeting this week, as it is unlikely to act before the Greek election June 17.
“I think we’ll have moments in time this week where we’ll get some intraday bounce, and maybe they’ll last for a day or two but I have to think the trend is going to be lower,” said Knapp.
Redler said the next couple of days will be telling. “If we can’t close back up above the 200-day historically, it means we have lower prices in front of us,” Redler said. “If we can’t reclaim the 200-day, it’s a technical sign of trouble ahead and we do have a long summer of headlines.”
The next level he is watching is 1,245/1,255. “I’d rather be a buyer into 1,245 to 1,255 than a seller, but that doesn’t mean that’s going to be the low of the summer,” he said.
Breaking the 200-day is not always a sign of trouble, but the last time the S&P 500 broke its 200-day was last August, and the market quickly lost more than 10 percent.
Richard Bernstein, CEO of Richard Bernstein Capital Management, said he sees investors as far too panicked, and he remains reasonably bullish.
“The data is disappointing. There’s no doubt about that. The question is what’s going to happen in the next six to 12 months. You can’t convince me that a 1.5 percent 10-year is not good for the economy,” said Bernstein. “…. Nobody is talking about how a 1.5 percent 10-year and much lower gasoline prices are going to help the economy.”
“Most important: When did a bear market ever begin with massive consistent outflow form equity mutual funds?” Bernstein said. “Our sentiment work really says that people have capitulated now. You want to know what bull markets are made of? When do bull markets ever start when things look good? Bull markets start when things look the worst.”
Follow Patti Domm on Twitter: @pattidomm
Questions? Comments? Email us at marketinsider@cnbc.com
