

Tired of August? Well, here comes September. And that’s likely not good news for investors.
Since 1896, September has been the worst month for the Dow , with the index posting an average loss of 1 percent.
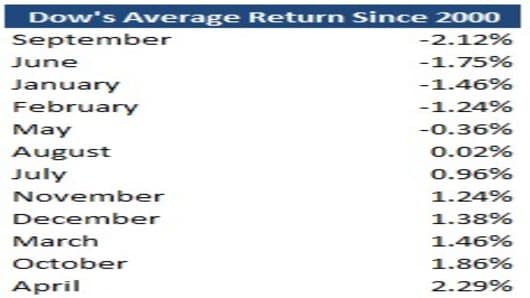
The average loss stands at 2 percent in the past 12 years.
During that period, there were 5 instances when the Dow fell more than 5 percent in September.

A glimmer of hope? In 5 of the last 7 Septembers the Dow managed finished the month in positive territory (Albeit the other 2 times, the Dow was down a solid -6 percent).
Here is a look at the Dow’s monthly performance:
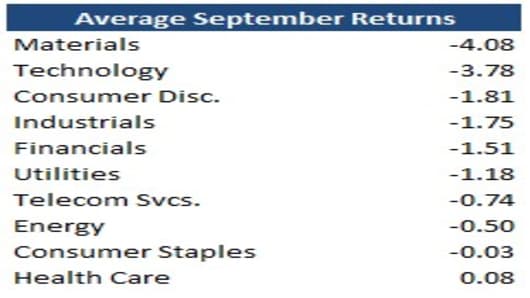
There haven’t been many places to hide in September in recent years. Since 2000, six of the ten S&P 500 sectors averaged a decline greater than 1 percent.
Historic Performance in September
Dow since 1896:
- On average, the Dow has lost -1.1 percent
- Down 58 percent of the time
- Best Sept. was in 1916, when it rose 12 percent
- Worst was in 1931, when it fell -31 percent
- On average, the Dow has lost -1.9 percent during Sept. when Aug. has been a positive month, down 85 percent of the time
S&P since 1928:
- On average, the S&Phas lost -1.2 percent
- Down 55 percent of the time
- Best Sept. was in 1939, when it rose 14 percent
- Worst was in 1931, when it fell -31 percent
- September on average ranks as the worst month out of the year for the S&P
- On average, the S&P has lost -1.6 percent during Sept. when Aug. has been a positive month, down 75 percent of the time
NASDAQ Composite since 1971:
- On average, the NASDAQ Compositehas lost -0.67
- Up 54 percent of the time
- Best Sept. was in 1998, when it rose 13 percent
- Worst was in 2001, when it fell -17 percent
- September on average ranks as worst month out of the year for the NASDAQ
- On average, the NASDAQ has lost -1.1 percent during Sept. when Aug. has been a positive month, down 55 percent of the time
