Farr: Analyzing the Output Gap

Farr: Analyzing the Output Gap
Jetta Productions | Getty Images

There was an interesting article in The Washington Post yesterday by Neil Irwin entitled "What Exactly is Dragging Down U.S. Economy". In this article, Irwin analyzes the output gap, which is defined as "the difference between what the U.S. economy is capable of producing and what it is actually producing."

This difference arises because the economy is operating at less than full employment and factories are not being fully utilized.

Irwin suggests that if the economy were operating at full capacity, economic activity would be higher by $973 billion compared to current levels. This $973 shortfall relative to potential represents over 6% of expected GDP for 2012.

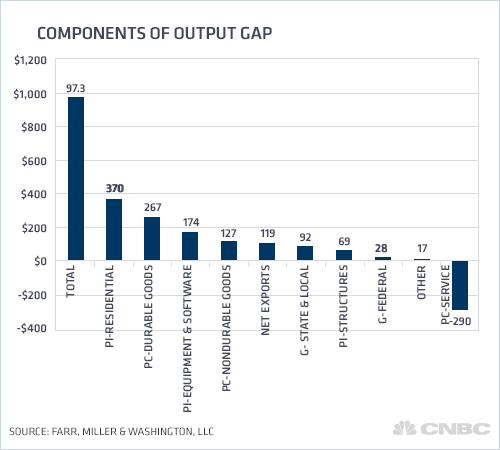
Irwin then goes on to break down the components of the $973 billion output gap.

To do this, he uses data from 1985 to 2005 to determine the average contribution from each sector of the economy to overall economic output. He then uses those averages to determine how much would be produced by each sector of the economy in a world of full employment and normal factory utilization. And finally, he compares those theoretical values to the actual current levels of production by each sector of the economy. Using this method, Irwin is able to give us an idea as to which sectors of the economy are most responsible for our current GDP shortfall relative to potential.

The conclusions to Irwin's analysis are summarized in the chart below, and they should not be overly surprising to anyone.

The two biggest contributors to the output gap are residential investment and consumer spending on durable goods (goods last more than three years). The shortfall from these two sectors combined comes to $637 billion, or 65% of the total output gap.

The reasons for the weakness in these sectors are fairly obvious. During the past few years, we witnessed the bursting of twin bubbles in housing and credit. Plummeting housing prices and reduced access to consumer credit has led to lower spending on residential investment and more expensive consumer items (which generally are bought using credit). At the same time, consumers remain fearful of job loss and stagnant incomes, causing them to spend less freely than in the past. Despite aggressive monetary policy by the Fed, we have not been able to break out of this vicious cycle for several years.

But there is cause for some optimism here.

As we have covered in previous market commentaries (most notable, "Hope for Housing", September 27), a wide variety of housing indicators are starting to look more positive for the first time in several years. At the same time, low interest rates, loosening credit, higher home prices, and stock market gains could contribute to continued gains in consumer spending in 2013. So while we remain mindful of the many economic obstacles that remain (fiscal cliff, Europe, China, etc), there may be hope ahead for a virtuous cycle of spending, job growth and economic expansion such that the output gap begins to shrink in 2013. As we have been saying for many years now, housing stabilization may be the key to our recovery.

As we talk with clients and prospective clients, many are wondering if the markets feel safe or if they should be invested at all.

Our quarterly Investor Sentiment Survey as described in The Arrogance Cycle shows very low levels of confidence despite strong year-to-date market returns. We agree that the economic and political landscapes are daunting but remind ourselves that no one can consistently predict short-term market outcomes.

Had we suggested to you in January that the S&P 500 would return over 16% in the first 9 months of the year (which it did), you may have asked to share some of whatever it was we must have been smoking. Investors' fear and lack of confidence are actually bullish indicators. Markets don't peak until taxi drivers are taking cash loans against their car titles to buy stocks. That markets climb walls of worry means that this one has further upside ahead. But always keep in mind that we really have no idea what the next 3, 6, or 12 months will bring. Bonds do not look at all attractive to us, so we prefer great balance sheets, reasonable prices, earnings growth and dividends. Johnson & Johnson is trading at 14 times earnings, carries a AAA credit rating (the United States is AA), and is paying a 3.6% dividend. While this is not to be in any way construed as a recommendation to buy or sell, we happily own J&J across most equity portfolios under our discretionary management.

Some folks have called us over the years and had us go to cash in their accounts. Some have been correct and others have not. We have one family who went to cash in 2008 and remains in cash. In and out decisions are fraught with peril, and most seasoned professionals advise against trying. To those investors who have guessed correctly in the past, we offer our congratulations. Our worry is that you've beaten the odds once and will be more tempted to try again. If you need some hand holding, counsel, or a review of your portfolio, give us a call. We are happy to try and help.

Michael K. Farr is President and majority owner of Farr, Miller & Washington, LLC. He is Chairman of the Investment Committee and is responsible for overseeing the day to day activities of the firm. Prior to starting FM&W, he was a Principal with Alex Brown & Sons.

Mr. Farr is a paid Contributor for CNBC television and has appeared on numerous broadcasts and has been quoted in global publications. He is a member of the Economic Club of Washington, DC, National Association for Business Economics, The World Presidents' Organization, and The Washington Association of Money Managers. He is the author of "A Million Is Not Enough," and "The Arrogance Cycle."