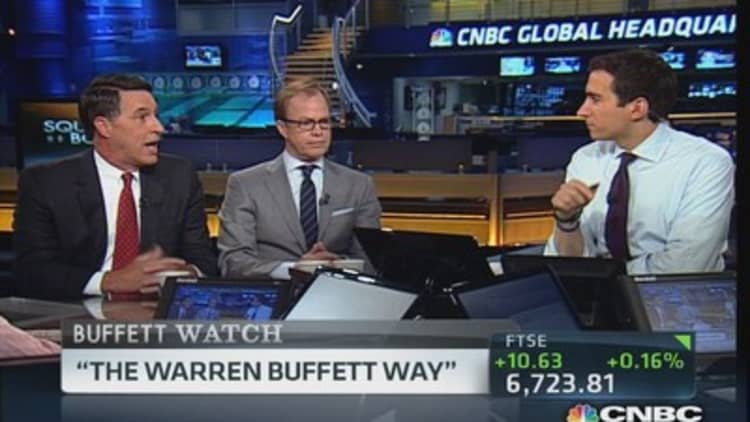
For the second straight year, shares of Warren Buffett's Berkshire Hathaway have outperformed the benchmark S&P 500 stock index.
Berkshire's Class A shares finished 2013 at $177,900, just below their 52-week high of $178,900 set in late July. That's up 32.70 percent from their $134,060 close in 2012. It's the biggest annual gain since 1998 when the shares soared 52.2 percent.
Berkshire's Class B shares gained 32.17 percent, closing at $118.56, up from $89.70 at the end of last year.
The S&P had its best year since 1997 with a spectacular gain of 29.60 percent, excluding dividends, but that's just below Berkshire's surge.
In 2012, the stock also came out ahead with a gain of 16.82 percent versus the S&P's 13.41 percent.
By Buffett's favored measurement, however, 2012 was "subpar."
(Read More: Berkshire Hathaway's 15 biggest stock holdings)
In his annual letter to shareholders released in March, Buffett compared Berkshire's per-share book value to the S&P 500 with dividends included. Berkshire's gain of 14.4 percent lagged the S&P's of 16.0 percent.
Buffett was disappointed, writing, "When the partnership I ran took control of Berkshire in 1965, I could never have dreamed that a year in which we had a gain of $24.1 billion would be subpar ... but subpar it was."

We won't know how Berkshire did by the book value metric until the company releases the next letter to shareholders in a few months.
Over the past ten years, Berkshire's stock has gained 111.16 percent, easily outpacing the S&P's 66.23 percent increase.
—By CNBC's Alex Crippen. Follow him on Twitter: @alexcrippen
Berkshire stock vs S&P excluding dividends
| Berkshire | S&P | |
|---|---|---|
| 2013 | +32.70% | +29.60% |
| 2012 | +16.82% | +13.41% |
| 2011 | -4.73% | +0.00% |
| 2010 | +21.42% | +12.78% |
| 2009 | +2.69% | +23.45% |
| 2008 | -31.78% | -38.49% |
| 2007 | +28.74% | +3.53% |
| 2006 | +24.11% | +13.62% |
| 2005 | +0.82% | +3.00% |
| 2004 | +4.33% | +8.99% |
| 2003 | +15.81% | +26.38% |
| 2002 | -3.77% | -23.37% |
| 2001 | +6.48% | -13.04% |
| 2000 | +26.56% | -10.14% |
| 1999 | -19.86% | +19.53% |
| 1998 | +52.17% | +26.67% |
| 1997 | +34.90% | +31.01% |
| 1996 | +6.23% | +20.26% |
| 1995 | +57.35% | +34.11% |
| 1994 | +24.96% | -1.54% |
| 1993 | +38.94% | +7.06% |
| 1992 | +29.83% | +4.46% |
| 1991 | +35.58% | +26.31% |
| 1990 | -23.05% | -5.83% |
| 1989 | +84.57% | +26.27% |
| 1988 | +59.32% | +12.40% |
| 1987 | +4.61% | +2.03% |
| 1986 | +14.17% | +14.62% |
| 1985 | +93.73% | +26.33% |
| 1984 | -2.67% | +1.40% |
| 1983 | +69.03% | +17.27% |
| 1982 | +38.39% | +14.76% |
| 1981 | +31.76% | -9.73% |
| 1980 | +32.81% | +25.77% |
| 1979 | +110.53% | +12.31% |
| 1978 | +10.14% | +1.06% |
| 1977 | +55.06% | -11.50% |
| Avg. Change | 26.44% | 9.31% |


