By the numbers: Measuring the economic divide

Closing the economic divide in America starts with a better understanding of how and where it shows up for millions of households.

There are a number of different ways to measure the gap, but the most powerful forces at work are differences in income growth and access to a good-paying job.

Here are some of the highlights of disparities in income and employment across racial and ethnic lines.

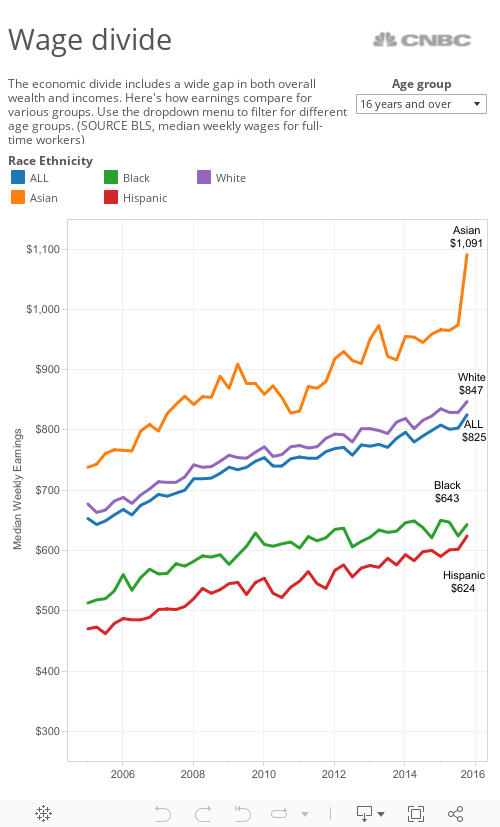
The wealth gap starts with income levels that remain sharply divided at all age groups along both those lines.

Access to a decent-paying job also shows up in the data on employment levels for various groups.

Despite the improved job market since the Great Recession, unemployment remains much lower among whites than blacks or Hispanics. As of last month, the unemployment rate among whites was 4.3 percent — about half a percentage point below the national average.

Among African-Americans 16 and older the jobless rate in January stood at 8.8 percent — down from 16.8 percent during the depths of the Great Recession. For blacks ages 16 to 19, 1 in 4 was unemployed last month. In 2010, the jobless rate for that group was nearly 50 percent — the highest in three decades.

Jobless rates vary widely from one part of the country to another, and some groups have fared better than others as the job market has improved.

For African-Americans, the unemployment rate was lowest in Virginia (6.7 percent) and highest in Illinois (13.1 percent) during the fourth quarter of 2015, based on an analysis of Labor Department data by the Economic Policy Institute. That meant the lowest black state-level unemployment rate in the country was the same as the highest state jobless rate for white workers (6.7 percent in West Virginia).

In all but 15 states, the jobless rate for African-Americans was 10 percent or higher in the fourth quarter of 2015. That's more than double the national average of 4.9 percent last month.

Those state averages may understate the level of joblessness because many workers aren't counted as being part of the official labor force. In many states that rate — which measures what portion of the population is actively looking for a job — is lower than the national average for some groups.

Access to occupations also varies across racial and ethnic groups along with age and gender.

While white men account for only 34 percent of the U.S. workforce, for example, they fill 49 percent of the jobs in occupations related to computers and mathematics. Only 2.8 percent of those jobs are held black women, though they make up more than 6 percent of the workforce.

Here's how various occupations are represented by race and ethnicity, compared to the share those groups represent in the overall population.

Watch CNBC's "Power Lunch" each day this week to see work being done to bridge America's divide.