Charts: What's the real unemployment rate?

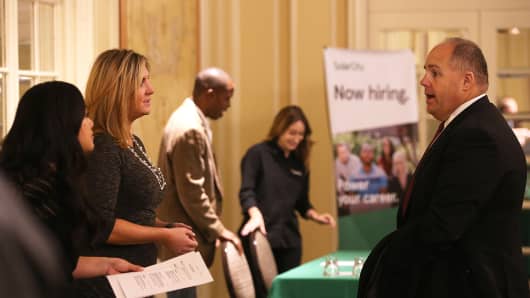
A job seeker, right, meets with recruiters during the HireLive Career Fair in San Francisco.
Getty Images
A job seeker, right, meets with recruiters during the HireLive Career Fair in San Francisco.

The U.S. unemployment rate rose to 4.9 percent in June, the Labor Department said Friday. But does that tell the whole story?

Each month on jobs Friday, the Labor Department's Bureau of Labor Statistics puts out a slew of employment-related data, each of which tells its own story about the U.S. employment situation. Most economists look past the official unemployment rate — also know as the "U-3" number — to other metrics that provide more nuanced views of the state of jobs.

The U-3 rate is defined as the "total unemployed, as a percent of the civilian labor force," but doesn't include a number of employment situations. A broader figure is the U-6 rate, which many economists rely on as a more accurate portrayal of employment in the country.

The U-6 rate dropped one-tenth of a point to 9.6 percent in June.

The U-6 rate is defined as all unemployed as well as "persons marginally attached to the labor force, plus total employed part time for economic reasons, as a percent of the labor force." That means the unemployed, the underemployed and the discouraged.

While the U-6 rate has made substantial gains in the past years, it remains stubbornly at pre-recession levels. It's also been more volatile than the U-3 rate. The U-6 is down 90 basis points over the past year, versus a 40-point drop in the U-3.

Market watchers are paying close attention to the jobs report this month to see what effects it will have on the Federal Reserve's decision on whether to raise interest rates in June. Federal Reserve Chair Janet Yellen has said the committee is waiting for improvement in the job market before raising rates.

The nation added 287,000 jobs in June, beating economists' estimates of around 180,000.

In recently released minutes, the Fed cited jobs as one of three areas it would like to see improvement before an interest rate hike would be likely. Members disagreed on the direction of the labor situation. Some pointed to the decline in the participation rate as evidence of slowing growth. Others said it was likely to have some hiccups on the way to full employment.

In June, the participation rate dropped to 62.7 percent.

The participation rate has fallen since the recession, but economists don't agree on why. Some suggest that demographic shifts — mainly the retiring baby boomers — is the main cause. Others think it's more cyclical factors or changes in the economy.

Another measure of the employment situation used by economists is the ratio of vacancies posted (v) to the number of unemployed persons (u). The v/u ratio measures labor tightness: A rising indicator means more businesses are looking to fill positions relative to the number of job seekers.

The v/u ratio had been rising since the end of the recession, but slowed at the end of 2015. It rose in April to 0.731, the most recent figure available.

As the labor market tightens and more people find work, you'd expect wages to rise as employers compete against each other for the remaining qualified candidates. Over the past year, economists have worried about the progress in wage gains. In recent months, though, we've seen them move upwards.

In June, average hourly wages rose two cents an hour to $25.61. Average weekly wages climbed to $880.98.