


While the market may seem fairly steady, CNBC's Jim Cramer has noticed some major rotations swaying stocks below the surface as geopolitical tensions grow more strained.
"The truth is we're in unfamiliar territory here," the "Mad Money" host said. "While I'm pretty sanguine about the broader market, I can't blame anyone who wants to fall back on some nice, safe, steady-eddy companies with stocks that you can trust."
That's why Cramer turned to technician Tim Collins, his colleague at RealMoney.com, to see what could be ahead for old-line pharmaceutical giant Eli Lilly, a familiar stock with a solid track record.
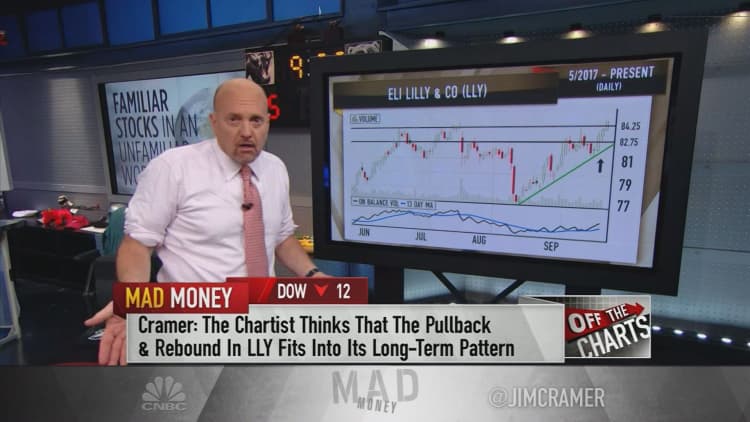
Eli Lilly's daily chart doesn't exactly make the stock look stable, tracking its journey from July, when it was $84 a share, to mid-August, when it fell to $77. But shares have since climbed back to around $84, a rebound that Collins argues is part of a long term pattern.
"Just look at that strong, extremely upward-sloping floor of support underneath," Cramer said, pointing to the green line. Every time Eli Lilly approached that floor in the last month, it swiftly bounced higher.
Collins also noticed the stock's On Balance Volume, a tool that predicts changes in a stock's path by measuring volume flow. Trading volume can help technicians tell when a stock's moves can be trusted by measuring how much the stock is being bought and sold on a given day.
Eli Lilly's On Balance Volume has held above its 13-day moving average, a sign that big institutions are gobbling up shares and driving the stock higher.
This happened in June, but the stock peaked at $84.25. That became a ceiling of resistance, eventually sending the stock down. However, shares of Eli Lilly broke above $84.25 this Monday, triggering a wave of buying and pushing the On Balance Volume line up.
"At these levels, Collins likes that Eli Lilly has two very clear floors of support underneath. It's got one at $84.25 and one at $82.75. Even better, because the stock recently started hitting new highs, it has no real ceiling of resistance," Cramer said.
But Collins said Eli Lilly's weekly chart paints an even better picture.
The pharma giant's stock has been trading in a range of $77 to $85 for most of 2017, testing the bottom and top levels to form a bullish W pattern, which usually suggests shares can go higher.
Collins believes that if Eli Lilly can break out above $85, less than $1 away from where it closed on Tuesday, the stock could climb to $90 or $92 a share by the end of the year, and even $100 a share by Memorial Day.
If the stock can't top the $85 level, Collins suggested waiting for a pullback and buying shares when Eli Lilly is close to its $77 to $79 floor of support.
"Bottom line: the charts, as interpreted by Tim Collins, who's been red-hot, suggest that Eli Lilly could have a lot of upside here, with not as much potential on the way down," Cramer said. "As I've said, I am a huge fan of Lilly the company, and in a chaotic world, you could do a lot worse than this high-quality big pharma company."
WATCH: Cramer's charts lean positive for Eli Lilly
Disclosure: Cramer's charitable trust owns shares of Eli Lilly.
Questions for Cramer?
Call Cramer: 1-800-743-CNBC
Want to take a deep dive into Cramer's world? Hit him up!
Mad Money Twitter - Jim Cramer Twitter - Facebook - Instagram - Vine
Questions, comments, suggestions for the "Mad Money" website? madcap@cnbc.com