


It's old news that the market is hitting record highs almost every day, but CNBC's Jim Cramer has grown concerned that there could be danger lurking underneath the rally.
"On the surface, this market does look both astonishingly bullish and astoundingly placid. You've never seen a bull this calm before," the "Mad Money" host said. "And look, it makes sense. We've got nice earnings growth coupled with an accelerating economy [and] low interest rates both here and abroad, [the] perfect prescription for a healthy bull market."
But as volatility dwindles, with October on its way to being the least volatile month for equity markets in modern history, the chances of a pullback are growing more likely.
"Historically, periods of minimal volatility lead inexorably to periods of surging volatility, and when that happens, stocks tend to sell off, as many investors can't handle that turbulence," Cramer said.
"In other words, calmness breeds complacency, historically, and sooner or later complacency gets punished, sometimes with a slap on the wrist, sometimes with a full-on beat-down."
So Cramer turned to technician Carley Garner, the co-founder of DeCarley Trading, author of Higher Probability Commodity Trading and Cramer's colleague at RealMoney.com, to gauge the likelihood of a corrective drop.
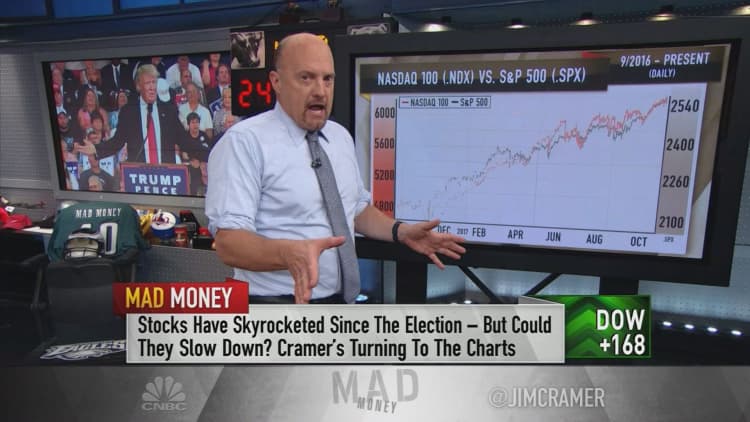
First, Garner looked at the implied volatility of both the Nasdaq 100 index, which consists of the top 100 non-financial stocks in the broader Nasdaq composite, and the . Implied volatility is calculated by looking at options trades: when people pay less for options, they're expecting a calmer market; when they pay more, they're anticipating more extreme action.
Garner found the implied volatility for the technology-heavy Nasdaq 100 approaching the low level of 12 percent for only the fourth time this decade, which signifies a huge lack of fear. S&P 500 futures are even more sedate, with implied volatility at an all-time low of less than 8 percent.
"Put it all together and Garner finds it hard to imagine how this market could become less volatile. But she thinks it can easily get more volatile, and when that happens, there's a decent chance that we will indeed get hit with a pullback," Cramer said.
The U.S. dollar's action could play into the negative outlook as well, Garner added. So far this year, the dollar has been fairly weak, a boon for multinational companies' earnings.
But the dollar is negatively correlated with S&P futures, which means that when the dollar goes down, stocks go up and vice versa. And, over the past five years, the dollar has tended to rally in late October and early November, a pattern that could pose problems for the S&P and Nasdaq.
Finally, Garner pointed to some worrying signs in the monthly charts of the two indexes. For one, the S&P 500's Relative Strength Index, which measures how overbought or oversold a stock or index is at a given time, just reached 80 for the first time since 2007.
"A reading over 70 is rare and signals that we're pretty overbought, meaning we've come up too far too fast," Cramer explained. "Over the last 20 years, the RSI on the S&P 500's monthly chart has broken out above 70 just three times ... One, the peak of the dot-com bubble in 1999 and 2000, then right before the financial crisis in 2007, and then the oil implosion in late 2014."
Plus, the S&P 500 is running close to its ceiling of resistance at 2600 and its floor of support is in the mid-2100s. Similarly the Nasdaq 100 is showing signs of being overbought and is close to its ceiling of resistance.
All in all, while Garner is not suggesting that investors should sell everything or that a crash is imminent, she sees much more potential downside than potential upside.
"Here's the bottom line: the charts, as interpreted by Carley Garner, who's been spot-on for us, suggest that this rally might have a shorter shelf-life than we'd like," Cramer said. "I'm a little more optimistic than that because the earnings from some of these great American companies have been so breathtaking. But you need to hear Garner's message because complacency, for all of us, is dangerous. When everyone else is euphoric after a huge run, it does not hurt for all of us to be a little more skeptical."
WATCH: Cramer's charts predict more pain than gain for stocks
Questions for Cramer?
Call Cramer: 1-800-743-CNBC
Want to take a deep dive into Cramer's world? Hit him up!
Mad Money Twitter - Jim Cramer Twitter - Facebook - Instagram - Vine
Questions, comments, suggestions for the "Mad Money" website? madcap@cnbc.com