Stocks will continue to push upward before a final break in the next few months, serving as the last throes of what will be the longest bull market in history.
That is according to forecasts by technical analysts at ING, commenting on the hitting record levels this week.
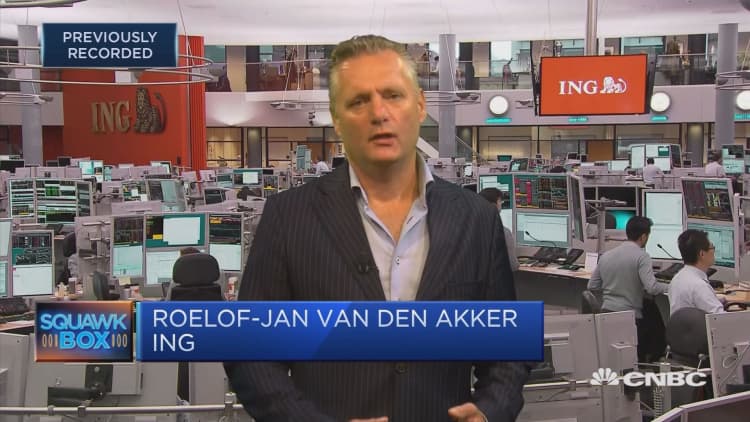
The 500-company benchmark index advanced 0.2 percent to close at 2,857.05 on Monday, and is now just under 0.6 percent from its record, reached in late January of this year. The fact that the market recently closed the downside January gap between 2,838 and 2,852 is "encouraging," said Roelof-Jan van den Akker, ING's senior technical analyst.
"That's telling me that we should expect a break above the upper end of this market, challenging to new all-time highs above the horizontal resistance at 2,875 in the end." The January record was 2,872.87.
"I believe a break above 2,875 would attract buyers, of course; that's a new phase that would suggest a resumption of this longer term uptrend," van den Akker told CNBC's "Squawk Box Europe" on Tuesday. A break above the 2,795 level a few months ago completed what the analyst called a bottle formation, whose size suggests a target of around 3,150 to 3,200 — "that's in line with our longer-term price target coming in around 3,130."
On Tuesday, the S&P 500 will equal the longest U.S. bull market since World War II; on August 22, it will be the longest in history at nearly 3,500 days. Since its bear market low of 676 on March 9, 2009, its risen more than 320 percent, with major market movers like Netflix and Ulta Beauty up more than an eye-watering 5,500 percent.
As the S&P is a market cap weighted index, the bigger the market cap, the more it can move markets. Other companies making up some of the index's big gains are Amazon, which accounted for 4.1 percent of gains since 2009, followed by Microsoft, J.P. Morgan, General Electric and Wells Fargo.
Final move?
But there are certainly no shortage of bearish warnings out there, as van den Akker points out — all bull runs eventually come to an end. Could this be its last hurrah? Yes, ING's analysts believe.
"This could be the final rise of this bull market, because it's already so long, so there's a lot of bearishness out there," Akker said, adding that he wouldn't be surprised by a break above 2,875 in another short squeeze out of the markets. "But that would possibly be the final move within this longer-term uptrend."

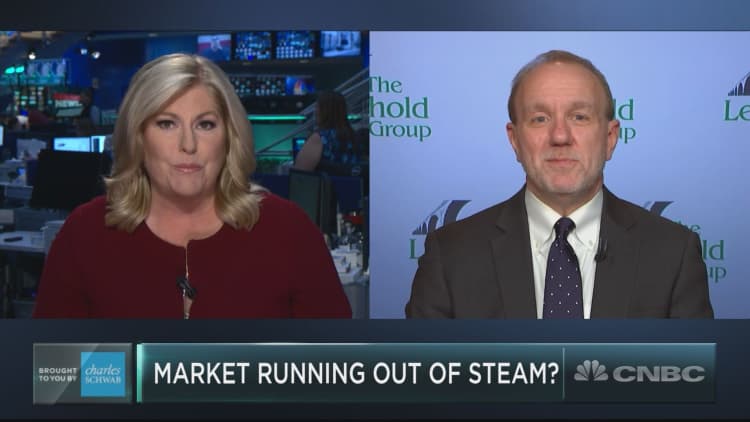
Jim Paulsen, chief investment strategist at Leuthold Group, agrees. As certain market-moving metrics reach peak levels, Paulsen worries that there is no room left for them to grow. Stock valuations are now among the top 82 percent of market history in the post-war period, yields are competitively low and already moving higher, confidence majors are near record highs, and the unemployment rate of 3.9 percent can't get much better.
"When you run out of the ability to improve things that'll help the market," Paulsen told CNBC in a prior interview, "you've got a market that is up against its upper bounds."
Or room to run?
Still, several investors see plenty of gas left in the tank for stocks.
Compared to the January peak before February's dramatic market correction, stocks were extremely overbought on the basis of RSI, or the relative strength index, according to Josh Brown, CEO at Ritholtz Wealth Management. RSI is a technical indicator charting the market's weakness or strength based on closing prices of a given trading period.
And 80 percent of stocks back in January were above their 200-day moving averages, an "absurd number" and overly bullish, Brown said. "Now we're looking at an RSI of about 59 to 60, much more healthy to be back at those levels and not yet overbought, which means there's a lot of room to run here."

'Final stages of a larger top'
In addition, volatility is disappearing, van den Akker told CNBC, adding that prices recently closing the January downside gap indicated a strong market. "That's telling me we should be prepared for this upper breakout and that would attract new buyers," he said.
Nonetheless, the analyst expected levels to inevitably come down, perhaps sooner rather than later.
"I don't think that this price move will be very sustainable. We could see a rise for a couple of months, but again this market is in its final stages of completing a larger top formation."


