


CNBC's Jim Cramer on Tuesday gave a temperature check on the market after digesting analysis from a trusted chartist.
He continued to advise that investors remain cautious about the ongoing positive sentiment on Wall Street.
"This is still a very uncertain moment," the "Mad Money" host said. "We don't know if we'll be able to safely reopen the economy without causing a second wave of Covid infections. We don't know when we'll get a vaccine. We don't know how quickly the economy can recover."
Cramer sought advice from technician Carolyn Boroden, the operator of FibonacciQueen.com and a contributor to RealMoney.com, who he said "nailed the crash" earlier this year. She uses what's known as Fibonacci methodology, where ratios are used to predict price movements.
Cramer likes to get a read on the charts to get an empirical assessment of the market. Boroden sees a scenario where the S&P 500 could rally another 27% from Tuesday's close, should the index meet a key hurdle.
"The charts, as interpreted by Carolyn Boroden, suggest that the major averages are still in rally mode," Cramer said, "but it's a precarious rally where you need to proceed with caution if we fail to break out from these levels and slip back to where we were not that long ago."
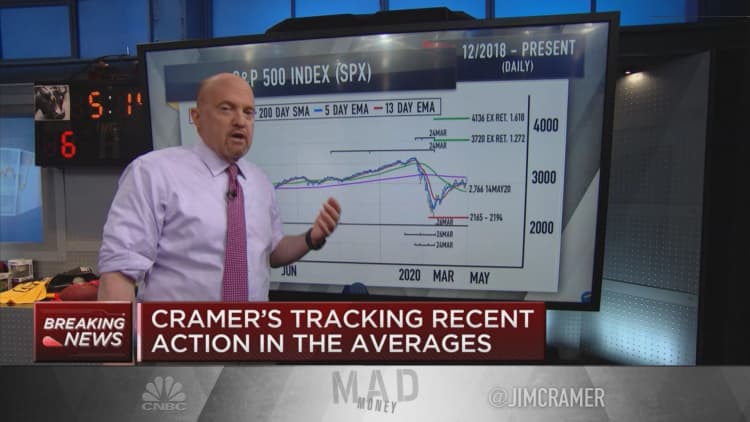
Looking at the daily chart of the S&P 500, Boroden thinks the chart is presenting a more optimistic picture, Cramer explained. The index has posted higher highs and lower lows, and it has flashed a buy trigger for the chartist. But until the S&P 500 breaks above its 200-day moving average of about 3,000, it remains vulnerable to downside pressure, Cramer said.
"She thinks the S&P is a buy right here. There's too much going right in her charts for her to say anything else," the host said. "However, she says you should be ready to sell if we fail to break out over the 200-day moving average, eventually."
In early March, in the height of the coronavirus sell-off that drove Wall Street from a bull to bear market in a matter of weeks, Boroden argued the S&P 500 had more room to fall. The index bottomed later that month and the analyst is now considering whether the benchmark index is presenting a buying opportunity, Cramer said.
If the index does breach that level, Boroden has price targets of 3,720 and possibly 4,136 on her radar, Cramer continued.
"That would be huge," he said. "But if the S&P can't clear that hurdle, if instead it breaks down below the May 14 low at 2,766 ... [then] all bets are off."
Questions for Cramer?
Call Cramer: 1-800-743-CNBC
Want to take a deep dive into Cramer's world? Hit him up!
Mad Money Twitter - Jim Cramer Twitter - Facebook - Instagram
Questions, comments, suggestions for the "Mad Money" website? madcap@cnbc.com