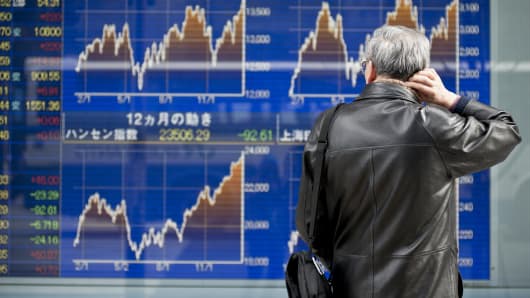
The retracement in the Nikkei has been sudden, with a 7 percent one-day fall. However, this retracement is still consistent with a continuation of the uptrend. From a technical perspective a retracement of less than 10 percent is considered as a correction rather than a trend change. The Nikkei will need to close convincingly below 14,348 to signal the retracement has become a trend change. The 14,348 level is 10 percent below the peak high of 15,942. Look for a close on a weekly chart below this level to invalidate the 10 percent correction and signal a trend change.
There is a second factor with the Nikkei that suggests a retracement of more than 10 percent is still consistent with the continuation of the uptrend. This is the position of the longer term uptrend line starting from the November 2011 trend rise. This suggests the Nikkei could fall to around 13,656 and then rebound from the value of the up trend line. This is a retreat of 11.8 percent and it is a fall below the historical support level near 14,000. However, this level is also around the value of the lower edge of the long tern group of moving averages in the Guppy Multiple Moving Average indicator.
(Read More:
Sell-Off Is Clear 'Warning Shot' for Nikkei: Pro
)
The GMMA captures the behavior of traders and investors. The long term group shows investors behavior. Wide separation shows strong support for the trend. This wide separation acts as a shock absorber and absorbs panic style selling from traders. The current GMMA relationship suggests there is a low probability that a retreat to the trend line will be the beginning of a trend change. It is more consistent with a retracement.
The key feature going forward is to watch for the development of any end of trend patterns, such as a head and shoulder pattern. This is created by a new higher high, a retreat, and then a new lower high. This would signal a potential end of uptrend behavior.
A rebound from the trend line followed by new highs, and a retreat and rebound from the trend line signals a trend continuation. The next resistance level for the Nikkei is near 17,000.
Daryl Guppy is a trader and author of Trend Trading, The 36 Strategies of the Chinese for Financial Traders –www.guppytraders.com. He is a regular guest on CNBC Asia Squawk Box. He is a speaker at trading conferences in China, Asia, Australia and Europe.
If you would like Daryl to chart a specific stock, commodity or currency, please write to us at ChartingAsia@cnbc.com. We welcome all questions, comments and requests.
NBC assumes no responsibility for any losses, damages or liability whatsoever suffered or incurred by any person, resulting from or attributable to the use of the information published on this site. User is using this information at his/her sole risk.


