Vultures Circling Vietnam

Emerging markets represent a lucrative yet dangerous option for an investor. You have to be a little bit of a maverick to invest in markets like Brazil, India, Turkey and Vietnam to name a few, because not only can you make a lot of money, you could just as easily lose your fortune.

But emerging markets have been faring pretty well the last five years, with the benchmark MSCI Emerging Markets Index rising more than 25 percent in 2007. According to Aberdeen Asset Management, by region, the Indian subcontinent was up 55 percent, whilst Latin America was up 35 percent over the year.

Charting Asia recently took a look at India's SENSEX. We thought we'd take a look at a smaller, yet equally as lucrative emerging market -- the Vietnam Index.

Falling stocks and markets, are the favorite hunting ground for long-term investors who look for stocks trading below their fair value. The Vietnam market rose spectacularly in 2006 - 2007. It also suffered an equally spectacular fall in 2008. Many investors are beginning to think this market is moving below fair value.

Markets always look for support. This develops when prices fall to levels irresistible to buyers -- something quite aptly called vulture buying -- where investors wait for the market to reach its lows before they become buyers.

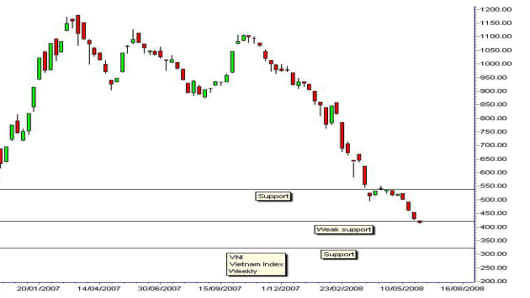
People use many different methods to decide when the low price is most attractive. We use charting and technical analysis to understand how other people are thinking and how they are behaving in the market. The three most important Vietnam numbers are 320, 420 and 540.

No Title_24959187

In markets, the past influences the future because traders and investors have memories. Money doesn’t know or care about what has happened. But traders and investors know the exact levels where they have made or lost money. This collective memory develops the support and resistance levels.

In November 2005 to February 2006 the market developed a significant resistance level near 320. This resistance level has the potential to act as a future support level. It is the lowest of the current support targets.

The first strong rally in the Vietnam market saw a fast rise from February 2006 until June 2006. This rise was followed by a retreat, and a retest of a resistance level in October 2006, and November 2006. This new resistance level at 540 provides the highest of the support levels.

From March to April 2008 this level provides the first significant pause point in the steady market decline that started in October 2007. This was not strong enough to stop the downtrend. It was the brake on the steady fall. It suggests that some aggressive investors were entering the market.

The retreat after June 2006 developed a rebound in August 2006. The low of this rebound point gives the third support figure at 420. The 420 support level is important because it is the rebound level in August 2006 that preceded the strong trend breakout in October 2006 which developed into the fast moving trend with the March 2007 all-time highs at 1,179.

CAvietnam.jpg

However, this is a single rebound point. The index did not consolidate at this level, which makes it a weak support level. There is a low probability of strong support developing near 420. Traders will take advantage of small rallies from this level, but there is less potential for a change in the trend.

In August 2006, the 420 level was also the top of the long-term Guppy Multiple Moving Averages (GMMA) display. We expect this to act as a support level. In 2008, this is equal to the lower level of the short-term GMMA.

The 2008 market is dominated by resistance factors. The strongest support level is at 320. Investors eyeing the Vietnam market will pay particular attention as the market nears this level. They watch for evidence that support can hold. This evidence includes a sideways movement, with several successful tests and retests of the 320 level.

It will be a slow accumulation process, but it will happen because there is a significant group in the Vietnam market that specializes in vulture buying. Their motives may not be welcome, but their activities develop the essential consolidation and accumulationrequired for a trend reversal.


If you would like Daryl to chart a specific stock, commodity or currency, please write to us at ChartingAsia@cnbc.com. We welcome all questions, comments and requests.

CNBC assumes no responsibility for any losses, damages or liability whatsoever suffered or incurred by any person, resulting from or attributable to the use of the information published on this site. User is using this information at his/her sole risk.