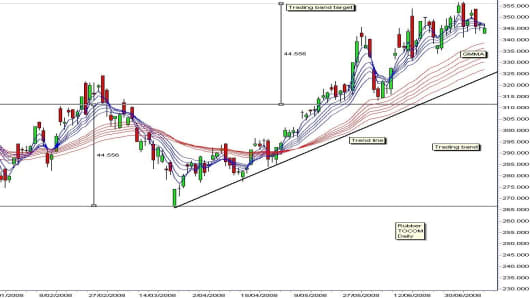
The daily rubber chart is defined with two key features. The first is a trading band. The lower edge of the band is located near 265. The upper edge of the band is located near 310. From November 2007 through May 2008 the price activity was confined within this band. The market essentially moved sideways in a 17% range in period when the oil price added 55%.
The breakout above the upper resistance band near 310 helped to create the second feature on the chart. This is the strong and well defined trend line starting with the March 2008 low. The target for the breakout above 310 is near 355. This is calculated by projecting the width of the trading band upwards. The retreat from this resistance level is consistent with the pricing behavior for rubber.
There is an important difference with the breakout above 310 and it is shown by the behavior of the long term Guppy Multiple Moving Averages (GMMA) display. This group captures the behavior of investors. The price dip in June is the leading indicator of trend strength. This sharp sell off was driven by traders. Investors came into the market as buyers. They did not join the sellers. We reach this conclusion because the long term GMMA did not compress in reaction to the selloff. Investor support was bullish and it remains bullish. Currently there is no evidence of compression in the long term GMMA.
This GMMA relationship suggests continued bullish pressure. It suggests that the current price retreat has a high probability of rebounding from the trend line rather than continuing to retreat all the way back to support near 310. On the weekly chart the full impact of this bullish pressure is clear.
The weekly chart shows a long term up sloping triangle. This is a bullish chart pattern. The target projection for this pattern is set near 380. The pattern of behavior on the daily chart suggests there is a high probability the 380 target will be achieved as the rubber price rebounds from the trend line. Initial downside lows are in the 330 level. There is a higher probability of a repeat of the price activity seen in June with a fast rally towards the initial resistance at 355 and the longer term target near 380.
Rubber does not have the same driving power as oil. The bounce in this market is more closely related to long term factors rather than the more recent sharp acceleration of the oil price.
If you would like Daryl to chart a specific stock, commodity or currency, please write to us at ChartingAsia@cnbc.com. We welcome all questions, comments and requests.
CNBC assumes no responsibility for any losses, damages or liability whatsoever suffered or incurred by any person, resulting from or attributable to the use of the information published on this site. User is using this information at his/her sole risk.