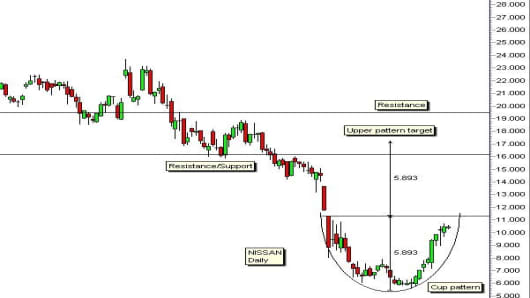
Normally a rounding bottom pattern develops over 3 to 6 months or longer and it is a shallow consolidation pattern. The saucer and rounding bottom patterns are part of the same family.
The pattern with Nissan is much deeper. The base of the pattern is near 5.00. The upper edge, or lip of the pattern is at 11.00. The shorter period and depth of pattern development suggests this is a cup and handle pattern development. This pattern has an additional feature which is the development of a handle. This is a pullback pattern that starts from near the upper edge of the cup.
Generally it’s a small retreat that is defined with an upper and lower trend line. Typically this continues for between 5 to 15 days. With Nissan this could drop price towards 9.00.
Cups, handles, what does it matter? It matters because it has an effect on the target price. The calculation of the target price in the cup pattern uses the depth of the pattern and projects it upwards. This gives a target near 17.00. If a handle develops, then the upside target is calculated from the level at which price moves above the upper edge of the handle. This could lower the target price to 15.00 or 16.00. It's bad luck for traders who have their heart set on sell orders at the higher target price of 17.00.
Chart pattern targets are validated, or confirmed by other chart features. The most important of these are nearby support or resistance areas. With Nissan there is a strong support area near 16.00. This suggests the price may have difficult it moving towards the higher target of 17.00 so traders will be ready to take an exit at the lower level.
More from CNBC.com
- Chrysler Lenders, Treasury Move Closer to a Deal
- Daimler Pact Eases Fiat Alliance
- GM Offers Final Survival Plan, Bond Deal
- Behind the Wheel with Phil LeBeau
In a very bullish breakout the price may accelerate beyond resistance at 16.00 but there is a strong crash barrier near 19.50. This is a strong trend reversal. Any move above the upper edge of the pattern near 11.00 is very bullish.
The next best thing to a car that turns on a dime is a stock that turns on a dime. Nissan has the tightest turnaround pattern of any of the big U.S. and Japanese automakers. It's definitely a company to watch and it's quarter earnings, to be released later this week, should be closely watched.
If you would like Daryl to chart a specific stock, commodity or currency, please write to us at ChartingAsia@cnbc.com. We welcome all questions, comments and requests.
CNBC assumes no responsibility for any losses, damages or liability whatsoever suffered or incurred by any person, resulting from or attributable to the use of the information published on this site. User is using this information at his/her sole risk.


