The first feature is the confirmed long term trend change shown by the "Guppy Multiple Moving Average". The stock has been enjoying increasing support from investors. The continued separation in the red long term group of moving averages shows investors are steadily buying into the trend. When price retreats, investors use this as a buying opportunity. If they were joining the sellers, we would see a compression in the long term group of averages.
The second feature includes the fast rise from $16.00 to $20.50. In particular, it includes the consolidation trading band between $18.50 and $20.50. It is this trading band that gives the first target for the breakout propelled by the earnings report. The width of the band is calculated, and this value projected upwards. This gives a target near $23.00. It’s a 12% rise, and not a bad return for a short-term trade.
The direction of the trend is unlikely to change, but the momentum of the trade can accelerate. The important feature is the upper edge of the trading band. A successful and sustainable fast moving breakout will use $20.50 as a support level in any retreat.
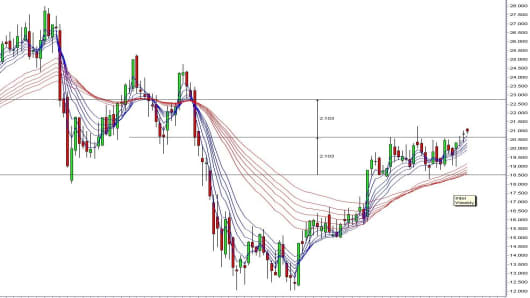
Intel has the characteristics of a trading stock. It has fast uptrends and fast downtrends. The downtrends are generally faster than the rises, so trading with a good stop loss is essential.
As such, there’s not much mileage in the earnings release ‘pop’ for Intel's case. It is more important, rather, to understand the behaviour of the rally trends when they breakout above the consolidation area.
If you would like Daryl to chart a specific stock, commodity or currency, please write to us at ChartingAsia@cnbc.com. We welcome all questions, comments and requests.
CNBC assumes no responsibility for any losses, damages or liability whatsoever suffered or incurred by any person, resulting from or attributable to the use of the information published on this site. User is using this information at his/her sole risk.