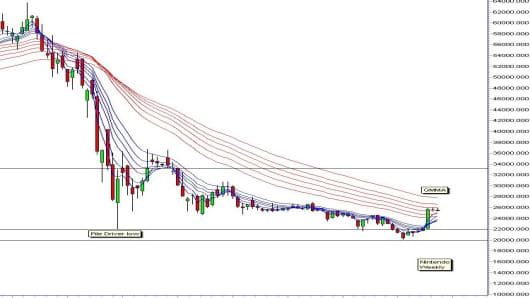
Looking at Nintendo's chart, the company's stock has been in a severe long term downtrend. The strength of the downtrend is confirmed by the Guppy Multiple Moving Averages (GMMA) display. This indicator uses two groups of moving averages to help understand the behaviour of the two most powerful groups in the market. The first group, shown by the blue short term averages, are the traders. The second group, shown by the red group of long term averages, are investors.
The separation in the long term group shows investors are not impressed with Nintendo. The recent price rally has not been enough to change their opinion. A change in investor opinion would be noted when the long term group of GMMA turned upwards and began to compress. There is some weak evidence of this, but the reaction is, at best, the first part of a three step trend recovery dance.
In this dance the initial rally is overwhelmed by investor selling. The retreat does not fall as far as the previous low. Traders rally again and may succeed in breaking above the upper edge of the long term GMMA. This rally collapses.
The third step of the recovery dance is when the second rally retreat used the lower edge of the long term GMMA as a support level. The next rebound is the signal for a trend breakout. The trader driven rally moves much higher and there is a sudden compression in the long term GMMA.
Aggressive traders will use steps 1 and 2 as rally trading opportunities. Step 1 and 2 do not automatically lead to step 3, so caution is required. Conservative traders will wait for evidence that step 3 is confirmed before entering the trend change. The upside target for this initial trend break is near 33,000.
The pile driver low pattern set the initial downside target near 22,000. The subsequent final low near 20,000 was lower and used an historical resistance level. This behaviour suggests the band between 20,000 and 22,000 will provide a reasonable support level for any retreat. A retreat from the current 26,00 high that finds a rebound from above 22,000 is a good indication that the second step of the 3 step recovery dance is developing.
Recoveries from long term trends are not rapid. It takes more than good, or better-than-expected earnings results to keep this dance going. The strength of investor disillusionment suggests Nintendo will remain a wall flower in the recovery dance for some time yet.
If you would like Daryl to chart a specific stock, commodity or currency, please write to us at ChartingAsia@cnbc.com. We welcome all questions, comments and requests.
CNBC assumes no responsibility for any losses, damages or liability whatsoever suffered or incurred by any person, resulting from or attributable to the use of the information published on this site. User is using this information at his/her sole risk.