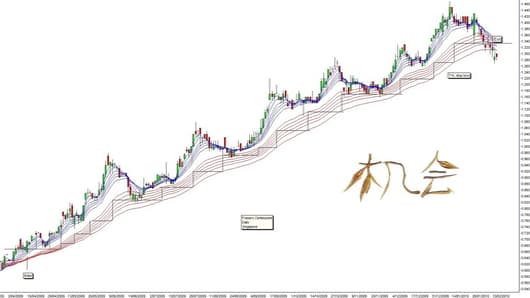
To illustrate my points, Singapore-Listed Fraser Centerpoint, which is one of my personal trades, provided a 102% return over 11 months. The chart is a record of the emotions of the crowd and it charts their behaviour.
If we ride the trend we need to know when to get off. We use a chart-based signal to make this decision. One of the most effective is a straight edge trend line, as seen in Fraser's chart.
A correctly plotted line appears to have an uncanny ability to define the trend. Prices move away from the line, then fall back to the line, hit it, and bounce away again. Some people see this and believe that a good trend line is able to predict what will happen. Not true. The line predicts what we will do when particular events happen in the future but it does not predict how price will behave. The trend line is a trade management tool.
The trend line simply tells that prices are still moving in a rising trend and that the crowd emotion has not changed. When prices drop below this line they tell us there is a strong probability that the uptrend, as we defined it, has ended because there is a change in crowd behaviour. Stay with this stock and we could start losing money and profits. Trends are the clearest evidence that prices in the market are not random.
When the trend line flashes a signal we need to make a decision about our involvement with the stock. We may choose to act on the signal, to look for another signal to confirm it, or ignore the signal completely.
The Fraser Centerpoint trend uses a translation of price activity to understand the changes in crowd behaviour. The Guppy Multiple Moving Averages (GMMA) display defines the trend. The GMMA Trend Volatility Line is a critical analysis of the trend. When price closes below the TVL line then its time to exit and take a 102% profit.
Daryl Guppy is a trader and author of Trend Trading, The 36 Strategies of the Chinese for Financial Traders –www.guppytraders.com.. He is a regular guest on CNBCAsia Squawk Box. He is a speaker at trading conferences in China, Asia, Australia and Europe.
If you would like Daryl to chart a specific stock, commodity or currency, please write to us at ChartingAsia@cnbc.com. We welcome all questions, comments and requests.
CNBC assumes no responsibility for any losses, damages or liability whatsoever suffered or incurred by any person, resulting from or attributable to the use of the information published on this site. User is using this information at his/her sole risk.