There are several support features in this momentum run. A successful test of these shows trend continuation and we keep our parity invitation tickets a little longer. Failure of these support features suggests its time to tear up the invitation and trade short.
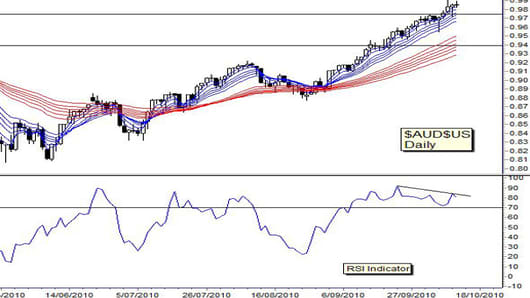
Historically resistance has been near $0.98, but the recent uptrend developed a small support area near $0.975. The lower edge of this support area is near $0.965. A fall into this support region shows a pause in the upward momentum. A fall below the level suggests a developing trend change.
The value of the lower edge of the short term Guppy Multiple Moving Average is near $0.965 and this provides a second support feature. This value will change and move up through the support consolidation area. A move below the 15 EMA that is also a move below $0.975 is a signal of developing trend weakness. A successful rebound from the value of the 15 EMA is a trend continuation supporting a move beyond parity.
The most powerful leading indicator of trend weakness is the Relative Strength Indicator when it develops a divergence pattern.
RSI divergence appears when the price behavior makes two new distinct peak highs. During the same time the RSI makes two distinct lower highs. The direction of the trend lines diverge, and this shows underlying weakness in the trend. Divergence signals are very reliable, but they are not so good when it comes to timing. The divergence signal may appear days or sometimes several weeks before the trend collapse develops. Additionally the RSI divergence signal does not provide a guide to the size of the retreat. Experienced chart analysts will see the previous RSI divergence on the chart in July which foreshadowed a small retreat from $0.92 to $0.88.
The Australia dollar chart shows an RSI divergence on the RSI indicator (See chart). However the two RSI peaks are not matched with distinct peaks in the Australia Dollar chart. This reduces the power of the divergence signal, but it remains an interesting warning of developing weakness.
My approach is simple. I'll accept the parity party invitation, but will stay close to the door, ready to run quickly for the exit.
Daryl Guppy is a trader and author of Trend Trading, The 36 Strategies of the Chinese for Financial Traders –www.guppytraders.com. He is a regular guest on CNBC's Asia Squawk Box. He is a speaker at trading conferences in China, Asia, Australia and Europe.
If you would like Daryl to chart a specific stock, commodity or currency, please write to us at ChartingAsia@cnbc.com. We welcome all questions, comments and requests.
CNBC assumes no responsibility for any losses, damages or liability whatsoever suffered or incurred by any person, resulting from or attributable to the use of the information published on this site. User is using this information at his/her sole risk.