

The Shanghai Index has staged a powerful breakout from a severe long-term downtrend. The breakout overcame two significant resistance features. The first feature was the strong resistance level near 2,300. The market consolidated around this level as the breakout developed.
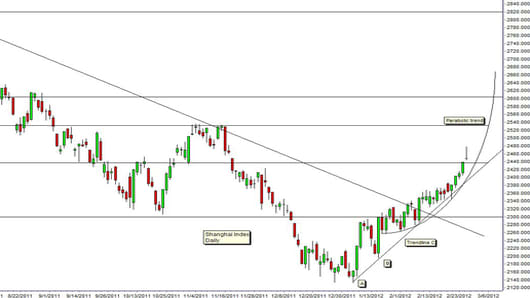
The second resistance feature was the long-term downtrend line that started in April 2011. The value of this trend line was also near 2,300, adding to the strength of resistance. The breakout above the value of the trend line confirmed the power of the new uptrend. This signaled a rapid move from 2,300 to the first resistance level near 2,440. This target was achieved this week.
This is a strong trend breakout, but is it a new uptrend, or just an extended rally? It’s a key question. If it’s a new uptrend then the next upside targets are near 2,540 and 2,600. Pullbacks are buying opportunities.
If this is just an extended rally then pullbacks are a signal to lock in profits. A rally failure and retreat from near 2,440 has a downside support target near 2,300.
Rally or trend? The difference comes from the pattern of retreat and rebound. A rally is a sustained upward move usually continuing for five to 10 days. Most of the candles are green with the index moving upwards almost every day. The rally may contain days where the index retreats but the retreat is small. Often the red candle will be higher than the previous green candle. It’s a short-term bullish rally. It is not a mature trend.
An extended rally has the same behavioral characteristics but may continue for 10 to 20 days. Long term extended rallies may develop parabolic trend behavior and this signals rapid and severe rally collapses.
A trend has different behavior. It includes rallies and substantial retreats followed by rebounds. A substantial retreat is confirmed when a new short-term downtrend line can be placed over the index activity. A substantial retreat is a fall in the index over three to five days or more. It shows a clear end to the current short-term uptrend or rally.
Trend line C shows the potential location of a new uptrend line. It is anchored to point A and B. It is a tentative line because the rally and retreat behavior between point A and B develop over a very short time. Trend line anchor points are usually separated by several weeks and this makes the trend line more reliable.
The most important feature of these retreats is the way any rebound develops. The low point of the retreat prior to the rebound provides an anchor point for the placement of a new long-term uptrend line.
A trend line that uses two location or anchor points is a tentative trend line. It is confirmed when a third significant retreat and rebound develops. The more times the trend line is hit and successfully acts as a rebound support level then the trend line becomes more reliable.
The Shanghai Index breakout above 2,300 has the characteristics of an extended rally. It has some of the characteristics of a parabolic trend.
A retreat and consolidation around the 2,440 level has the potential to develop a third significant point for the location of a long-term uptrend line. Current value is around 2,400.
In the current trend development it is not clear which is the dominant trend behavior.
The behavior of the index retreat and rebound will confirm if this is a sustainable long-term uptrend or a more volatile parabolic trend rally. A fall below the value of trend line C confirms the collapse of the extended rally. A rebound from trend line C confirms trend continuation with upside targets near 2,540.
Daryl Guppy is a trader and author of Trend Trading, The 36 Strategies of the Chinese for Financial Traders –www.guppytraders.com. He is a regular guest on CNBC's Asia Squawk Box. He is a speaker at trading conferences in China, Asia, Australia and Europe.
If you would like Daryl to chart a specific stock, commodity or currency, please write to us at ChartingAsia@cnbc.com. We welcome all questions, comments and requests.
CNBC assumes no responsibility for any losses, damages or liability whatsoever suffered or incurred by any person, resulting from or attributable to the use of the information published on this site. User is using this information at his/her sole risk.
Disclosure: Daryl Guppy has open long positions in Shanghai CSI Futures ETF
