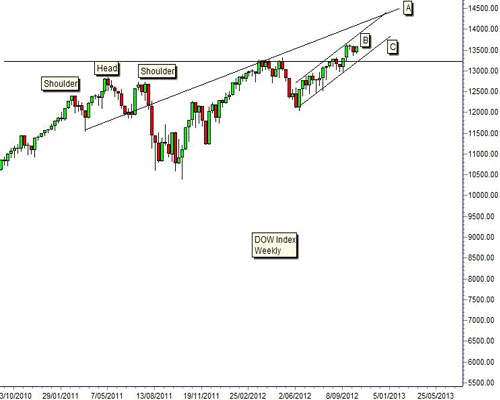
The second trend line is trend line B and the third is trend line C. These two trend lines form an upward sloping trend channel. Starting in June 2012 the Dow has used trend line C as a support level and trend line B as a resistance level. In this situation investors buy when the index moves towards the value of trend line C.
Trend line B will cross the long term uptrend line A during December 2012. When this crossover develops then trend line A will form the new resistance level for the Dow. This is why the upside target for the Dow is limited.
Currently the value of the lower trend line B has moved above the value of the small historical support and resistance level near 13,200. This is important because it means the Dow now has two support features. The first feature is the value of trend line C and the second support feature is the value of the support and resistance level near 13,200.
The Dow will continue to trade inside the up sloping trading channel and use trend line C as the support level. The value of trend line C will rise in the next few weeks and this gives a higher support level. This means that if the Dow falls below trend line C support then it will also find support near 13,200. This confirms there is reduced bearish conditions in the Dow index.
The pattern of support and resistance suggests the rise in the Dow is stable and slow. The Dow will only develop strong upwards momentum if the index succeeds in a breakout up above the resistance level created by trend line A. The current Dow index activity is not suitable for calculating upside targets if the index moves above the value of trend line A.
Daryl Guppy is a trader and author of Trend Trading, The 36 Strategies of the Chinese for Financial Traders –www.guppytraders.com. He is a regular guest on CNBC's Asia Squawk Box. He is a speaker at trading conferences in China, Asia, Australia and Europe.
If you would like Daryl to chart a specific stock, commodity or currency, please write to us at ChartingAsia@cnbc.com. We welcome all questions, comments and requests.
CNBC assumes no responsibility for any losses, damages or liability whatsoever suffered or incurred by any person, resulting from or attributable to the use of the information published on this site. User is using this information at his/her sole risk.


