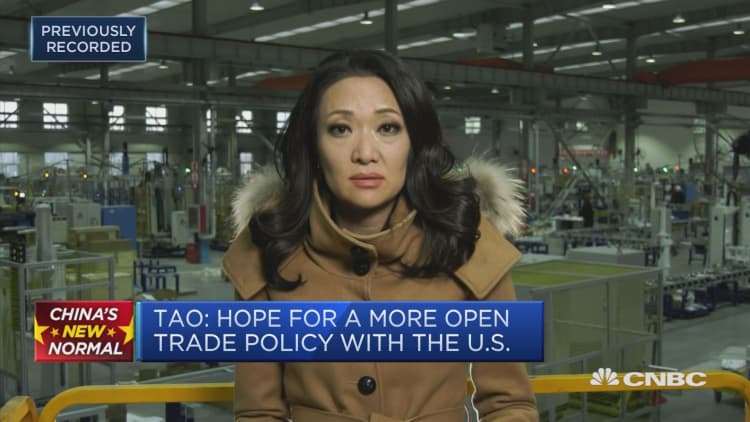
There is a persistent media approach that always finds something to criticize about China's economy.
China's growth is on track, but the reports are always tempered by warnings of doom, or suspect economic figures. Despite that, China's economy remains robust and healthy.
The Shanghai composite index developed a brief consolidation period around a resistance level near 3,440. As expected, the market retreated from 3,440, but it very quickly developed a strong rebound and a continuation of the rally.

The retreat did not fall below the lower edge of the short-term Guppy Multiple Moving Average. That is very bullish behavior. The short-term GMMA did not develop any significant compression with this pullback and this shows very strong trader confidence in the continuation of the uptrend.
Short term, traders are very confident about the trend direction and are actively buying at any sign of index weakness.
The long-term GMMA, which tracks the sentiment of investors, has turned up and is expanding. The upper edge of the long-term GMMA has moved above the resistance level near 3,360. Investors are more bullish. They have become strong active buyers. This strong buying activity is shown with the expansion in the long-term GMMA .
There are two resistance features for an uptrend continuation.
The first resistance feature for the breakout above the level near 3,440 is the long-term historical resistance target near 3,650. This is best seen on a weekly chart. This was a strong resistance level in November 2015 to January 2016. This strong resistance suggests the market may consolidate near this 3,650 level.
The second resistance feature is the value of the long-term uptrend line. The current value is near 3,500.The uptrend line started in May 2017 and acted as a support feature until November last year. It was tested five times as a support feature so it has a confirmed and powerful influence on the market. The value of this line will now act as a resistance feature.
This is a fast rally with limited consolidation. It is not possible to reliably set an uptrend trend line. The future pattern of rally, retreat and rebound rally will set the first anchor point for a new uptrend line. When this is established it will be possible to set more accurate index targets.
Daryl Guppy is a trader and author of Trend Trading, The 36 Strategies of the Chinese for Financial Traders, which can be found at www.guppytraders.com. He is a regular guest on CNBC Asia Squawk Box. He is a speaker at trading conferences in China, Asia, Australia and Europe. He is a special consultant to AxiCorp.
For more insight from CNBC contributors, follow @CNBCopinion on Twitter.


