


On the worst day this month for the major averages, CNBC's Jim Cramer wanted to take a step back and get some perspective on some of the market's hottest stocks.
So the "Mad Money" host called on Carolyn Boroden, the technician behind FibonacciQueen.com and his colleague at RealMoney.com, to explain why taking a longer term view on stocks can go a long way.
Her best example? The turbulent, short-seller-ridden stock of Elon Musk's automaker, Tesla.
In April, Tesla's daily chart looked incredibly bearish. Shares were tanking as more and more investors and analysts began to question Musk's leadership.
"But the weekly chart ... painted a very different picture," and it helped Boroden call Tesla's latest rally, Cramer said. The stock has run more than 20 percent since the company's early June shareholder meeting.
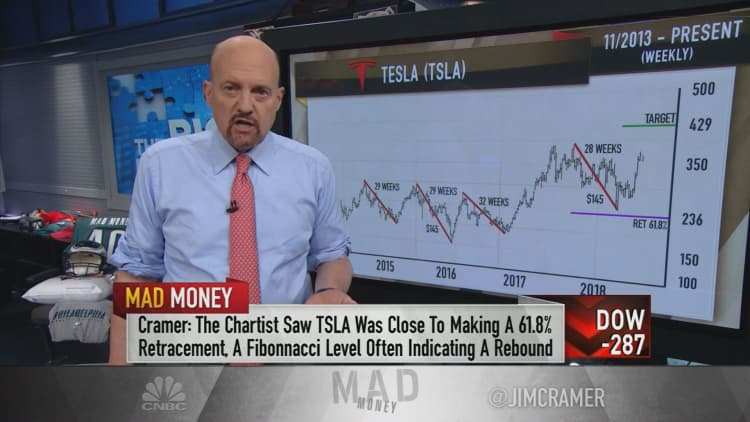
When she looked at the weekly chart in April, Boroden, who uses Fibonacci ratios to calculate stock patterns, noticed that Tesla's stock was down $145 from its previous high.
That decline mirrored one of the stock's previous drops, which got Boroden's gears turning. After all, Fibonacci ratios tend to be reflected in patterns that repeat over and over again in nature, like pine cones and snail shells. Oddly enough, they also tend to repeat in the stock market.
"Plus, the stock had been down for 28 weeks, very similar to a few other declines that ended after 29 to 32 weeks," Cramer noted.
"In the case of Tesla, Boroden saw that the stock was very close to making a 61.8 percent retracement — a very important Fibonacci level where falling stocks often rebound," he said.
When shares of Tesla followed this pattern in the past, Boroden found that the stock usually bounced and rallied hard, running up anywhere from $105 to $211.
"Based on this precedent, Boroden predicted that Tesla was ready to roar. Sure enough, the stock has already tacked on $108 bucks from its April lows, even after today's brutal $18 shellacking," Cramer said. "And look, she still thinks there could be more upside here."
"I bet you Elon Musk retweets this," he quipped.
But if investors had only looked at Tesla's daily chart back in April, they likely would've turned wildly bearish on the automaker's prospects, the "Mad Money" host said.
So don't be afraid to take a longer term view on key stocks when the market's in the red, Cramer told investors. You might just spot some hidden upside.
WATCH: Cramer's charts track shares of Tesla, Citigroup, CVS and Walgreens

Questions for Cramer?
Call Cramer: 1-800-743-CNBC
Want to take a deep dive into Cramer's world? Hit him up!
Mad Money Twitter - Jim Cramer Twitter - Facebook - Instagram - Vine
Questions, comments, suggestions for the "Mad Money" website? madcap@cnbc.com